Trading P&L calendar: how to read it and improve
A P&L calendar shows your result day by day. Here is how to read it in 4 passes, tell red inside the plan from green outside it, and use it in a prop firm challenge.
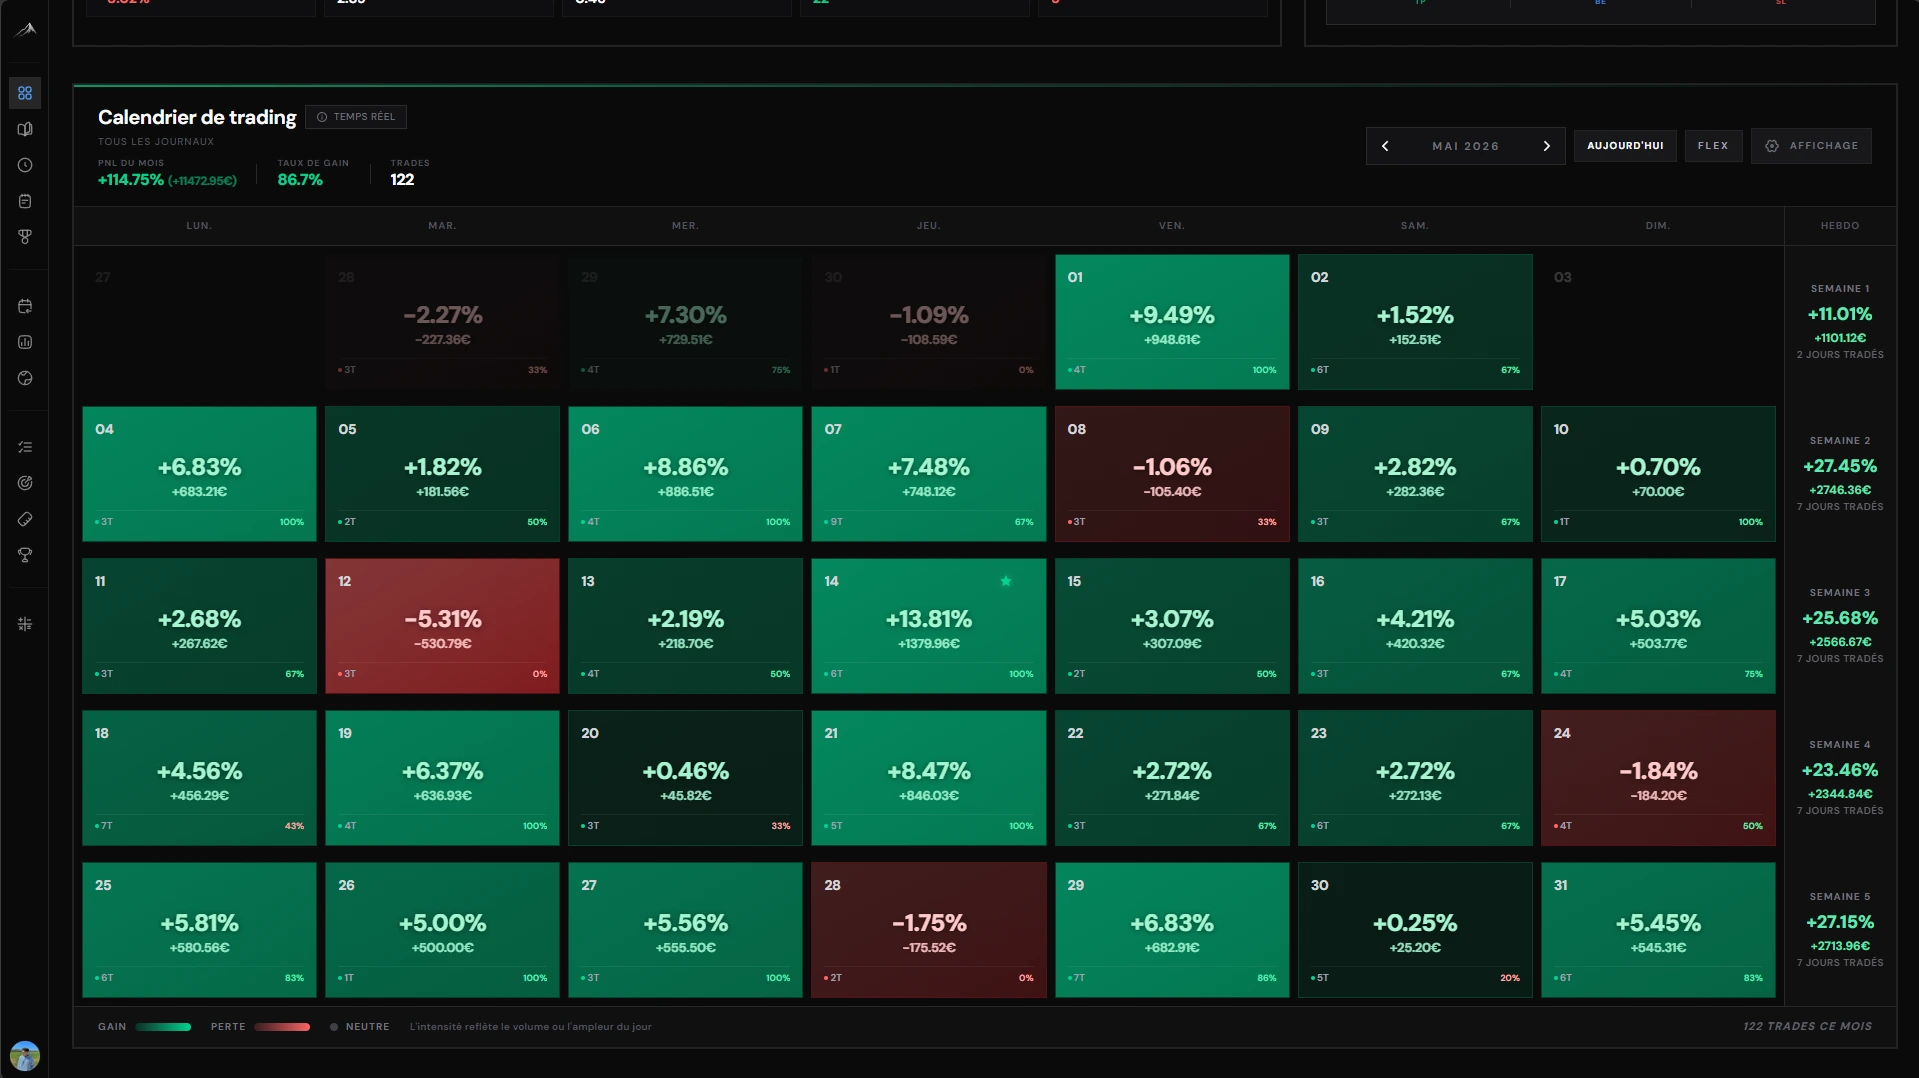
A trading P&L calendar shows your trading result day by day on a monthly grid. Winning days are green, losing days are red. It is easy to read, and that is the trap: you look at the colours, feel good or bad, and move on. This guide shows how to read the calendar so it ends with one concrete rule, including during a prop firm challenge.
What is a P&L calendar?
It is a regular calendar where each cell is a trading day. Inside the cell you usually see the net result of the trades closed that day. On the side, you usually get the weekly and monthly totals.
Three things to keep in mind:
- An empty cell is neither a win nor a loss. It is a day with no trade. Sometimes it is the best decision of the week.
- It is usually realized P&L. A position still open does not count until it is closed.
- Net, not gross. Commissions can turn a small green day red.
Why a calendar instead of a trade list
The equity curve tells you where you ended. The calendar shows how you got there. In a list of 200 trades you will not see that your losses come in streaks, or that your Mondays are often red. On a grid, it jumps out.
The calendar does not replace stats. It tells you where to look. Your trading journal statistics (win rate, expectancy, R:R) then tell you whether your edge holds.
Read the month in 4 passes
Do not look for an explanation right away. Observe first, in this order.
- Shape. Is the month mostly green, mostly red, or patchy? Are red days isolated or in a row? Three reds in a row after a big green day is often overconfidence, not bad luck.
- Size. Compare your worst red day with your best green day. If one red day wipes out several green ones, the issue is not your setup. It is your daily stop or your position size. Review your money management.
- Rhythm. Which weekdays carry the most trades? Are your red days also your busiest days? If so, read our guide on overtrading.
- Extremes. Open the worst day and the best day. Read every trade and the session note. That is where the real information is.
Red inside the plan, green outside the plan
This is the point most guides skip. The colour of a cell tells you whether you made money. It does not tell you whether you traded well.
- A red cell where every trade followed the plan is normal variance. Nothing to fix, unless it lasts over a real sample.
- A green cell with off-plan trades is a warning. You got paid for bad behaviour. That is how bad habits settle in.
To tell them apart, you need a written reference: your trading plan (allowed setups, max trades per day, daily stop). Then an "off plan" tag on every trade that breaks those rules. With that tag, each calendar cell reads in two colours: the result, and plan compliance.
Reading your calendar in a prop firm challenge
In a challenge, the calendar becomes a rules dashboard. Every firm has its own rules, so always check the exact number in its terms. The questions are the same, though.
- Max daily loss. For each red cell, check the distance to the daily limit. A day that came close to the limit almost counts as a lost day, even if the rule did not trigger.
- Max drawdown. Add up the reds of the week. A run of small losses can bring you to the drawdown faster than one big day.
- Minimum trading days. Some firms require a minimum number of traded days. Filled cells show it at a glance, without forcing trades just to tick a box.
- Consistency rule. Some firms cap the share of your best day in total profit. If one green day carries the whole month, the calendar shows it before the rule blocks your payout.
To go further, see our prop firm drawdown management method and our trading journal for prop firms page.
Reading traps
- One month is not much. Twenty-odd days prove nothing. Treat each pattern as a hypothesis to check next month.
- Green days and win rate are not the same. A day can be green with more losing trades than winners, if the winners are bigger.
- Size changes, amounts mislead. If your position size moved, compare in percentage rather than in currency.
- Watch trades that span two days. Depending on the tool, they count on the opening day or the closing day. Check how yours works and keep the same logic month to month.
- Do not trade to colour a cell. Wanting to "get back to green" at the end of the day is the door to revenge trading.
A 20-minute weekly review
Once a week, always at the same time.
- Look at the whole week. Shape, total, comparison with the previous week. No analysis yet.
- Open the worst day. Did the losses come from the plan or from off-plan trades? How much did the off-plan trades cost?
- Open the best day. One big trade or steady execution? Any off-plan trades hiding in the green?
- Reread your session notes for those two days. Fatigue, economic release, emotion?
- Write one rule for next week. Not "trade better", but "stop after 2 losses" or "no trades on Friday afternoon". One rule, not five.
The following week, the calendar tells you whether you kept it.
The P&L calendar in Altiora
In Altiora, the trading calendar shows your daily P&L and win rate, colour coded for gains and losses. Weekly and monthly recaps sit in the margin. One click on a day opens its trades. The display can be set to percentage or currency.
The calendar is fed by the journal. Your trades come in through native cTrader, Tradovate, TopstepX, or MT4/MT5 via import or EA. You add your tags (including "off plan") and your session notes. For funded accounts, prop firm tracking and multiple journals keep each account separate. Details are on the features page.
Want to see your own month in colour, with plan compliance next to it? The 7-day trial gives you full access.
Frequently asked questions
- What is a P&L calendar in trading?
- A monthly grid where each cell shows the net result of the trades closed that day, green for a gain and red for a loss, with weekly and monthly totals.
- How do you read a P&L calendar?
- In 4 passes: shape (streaks or isolated days), size (worst red vs best green), rhythm (busy days, weekdays), then extremes, by opening the worst and best days.
- Does a green day mean I traded well?
- No. A green day can include off-plan trades. Tag those trades in your journal so each cell reads with plan compliance, not only the result.
- Is a P&L calendar useful in a prop firm challenge?
- Yes. It helps you track max daily loss, drawdown, minimum trading days and the consistency rule. Always check the exact numbers in your firm's rules.
About the author
L’équipe Altiora
Altiora editorial team
Altiora's editorial team brings together active traders and the product team. We write about discipline, journaling and performance analysis, grounded in how the platform actually works. We never give investment advice.
Read next
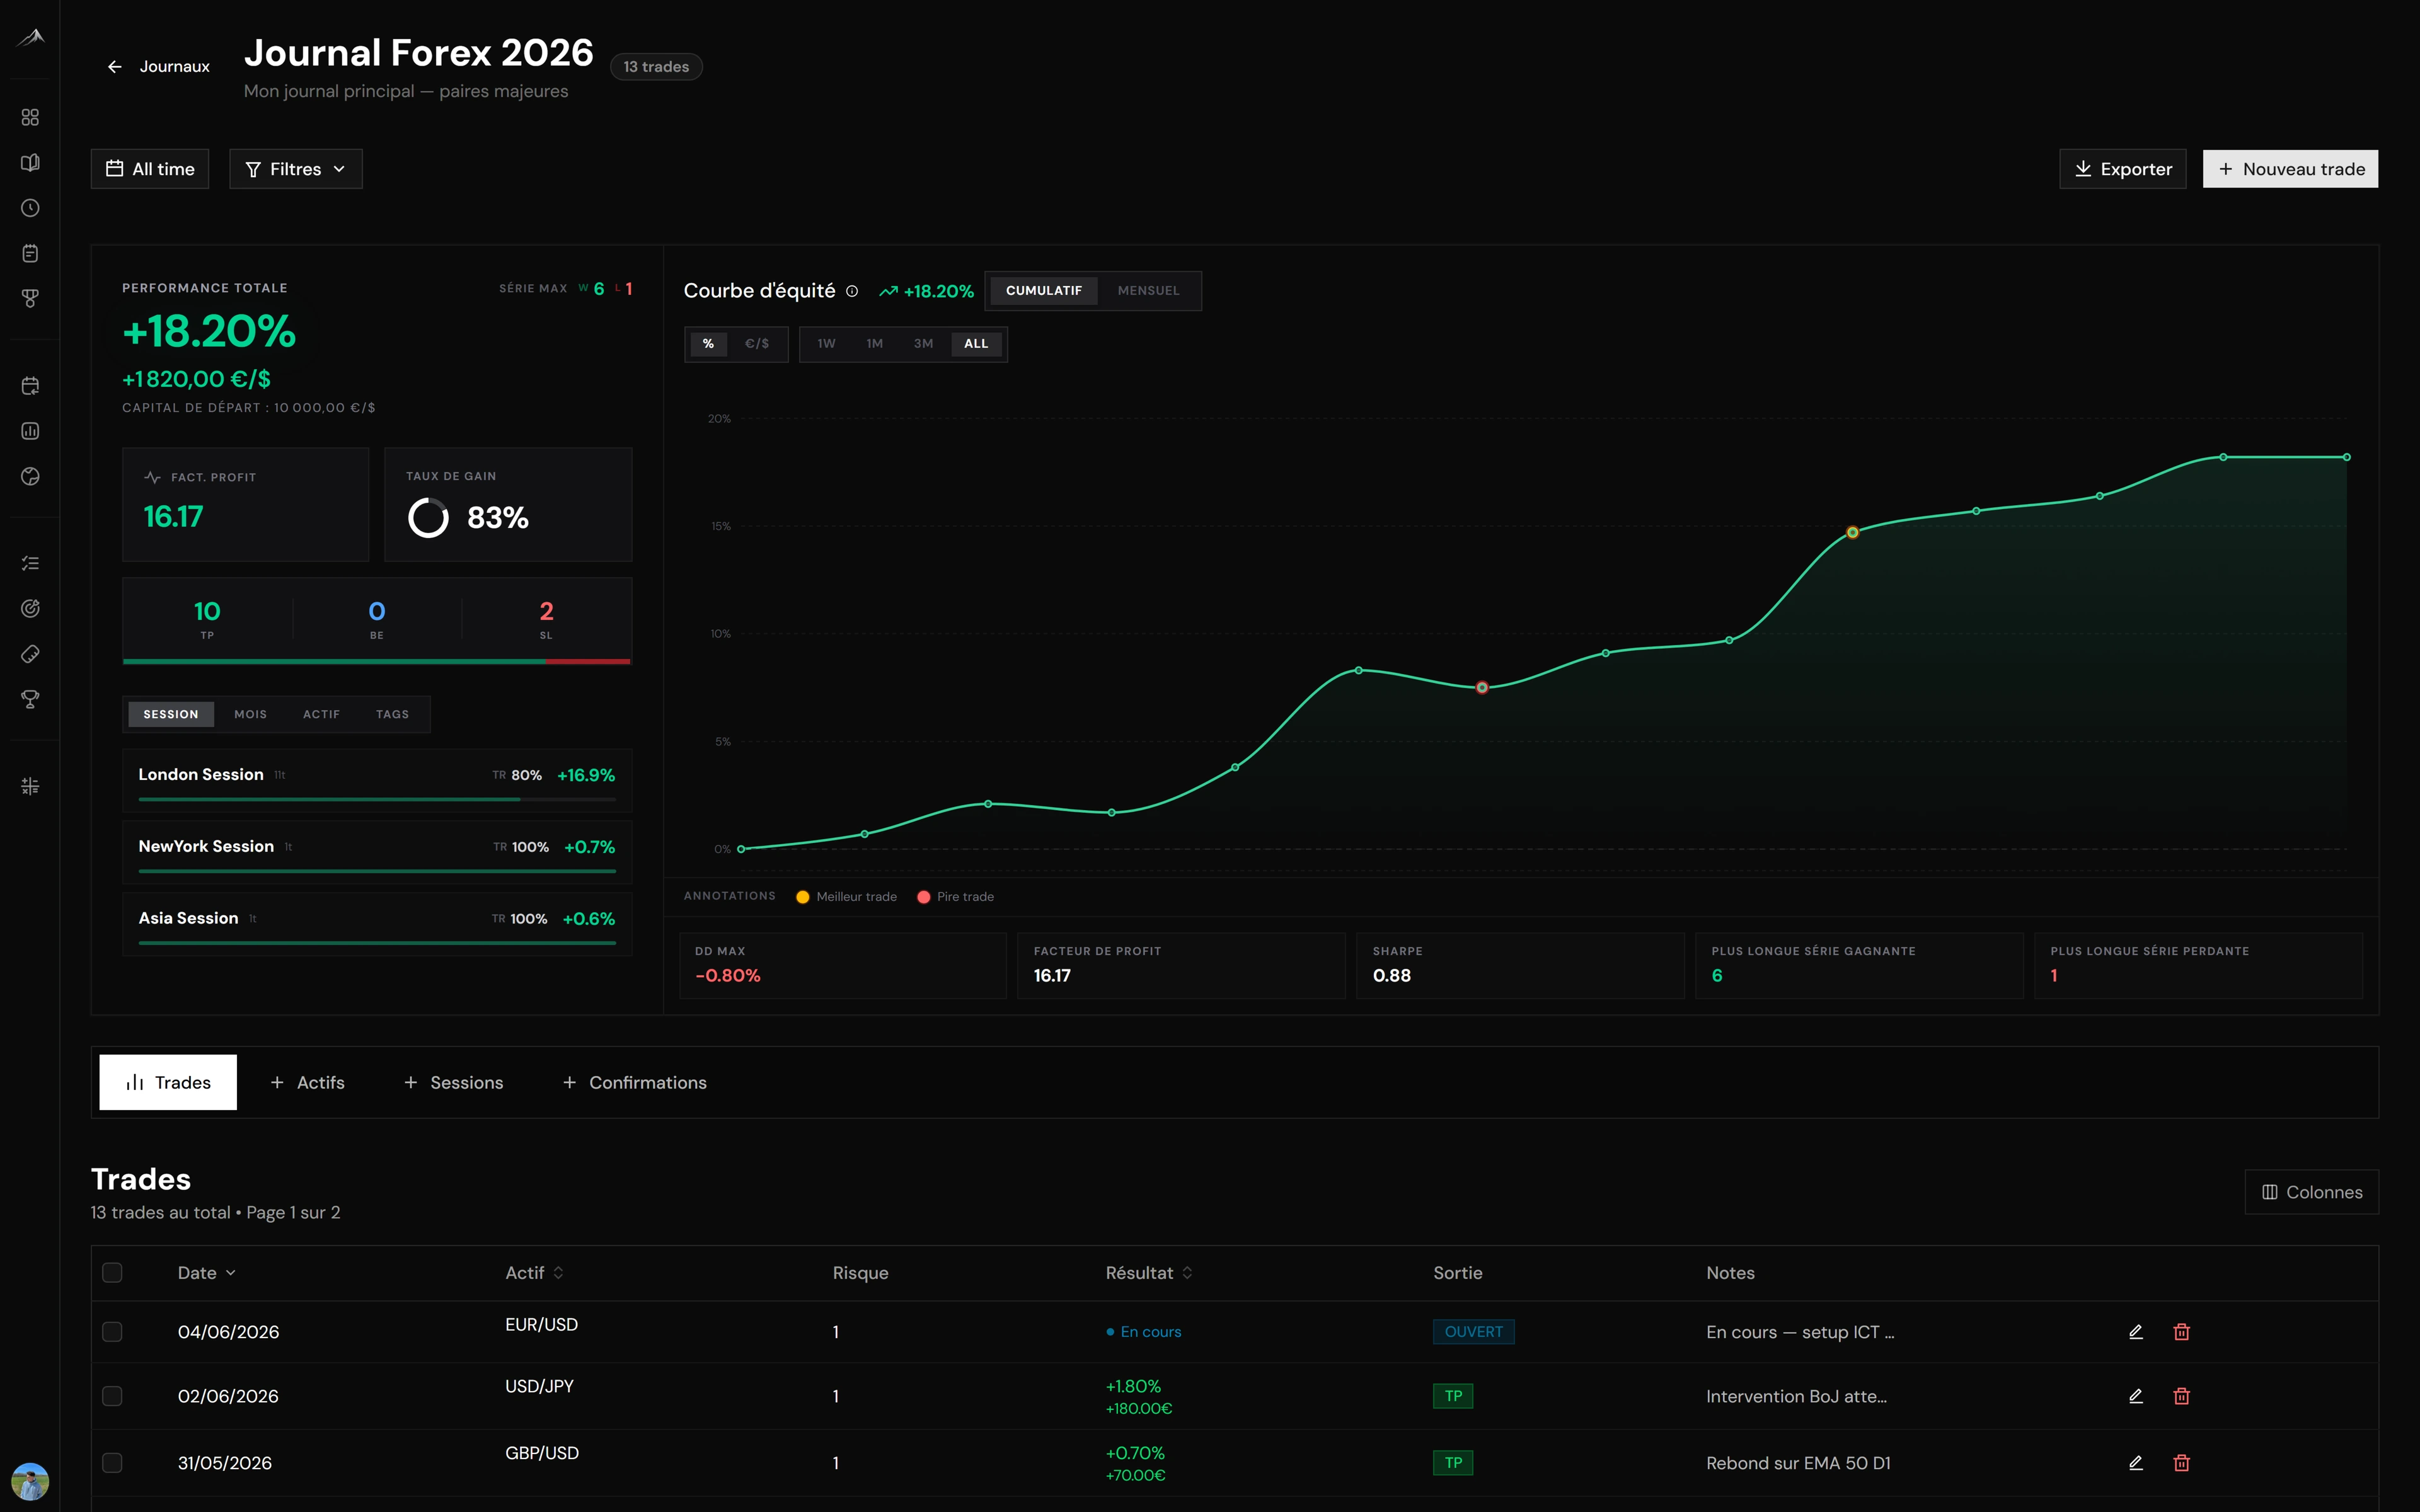
Trading journal: the complete guide to getting better
Why keeping a trading journal changes everything, what to record, which statistics to track, and how to move from a manual notebook to automated tracking that actually compounds.
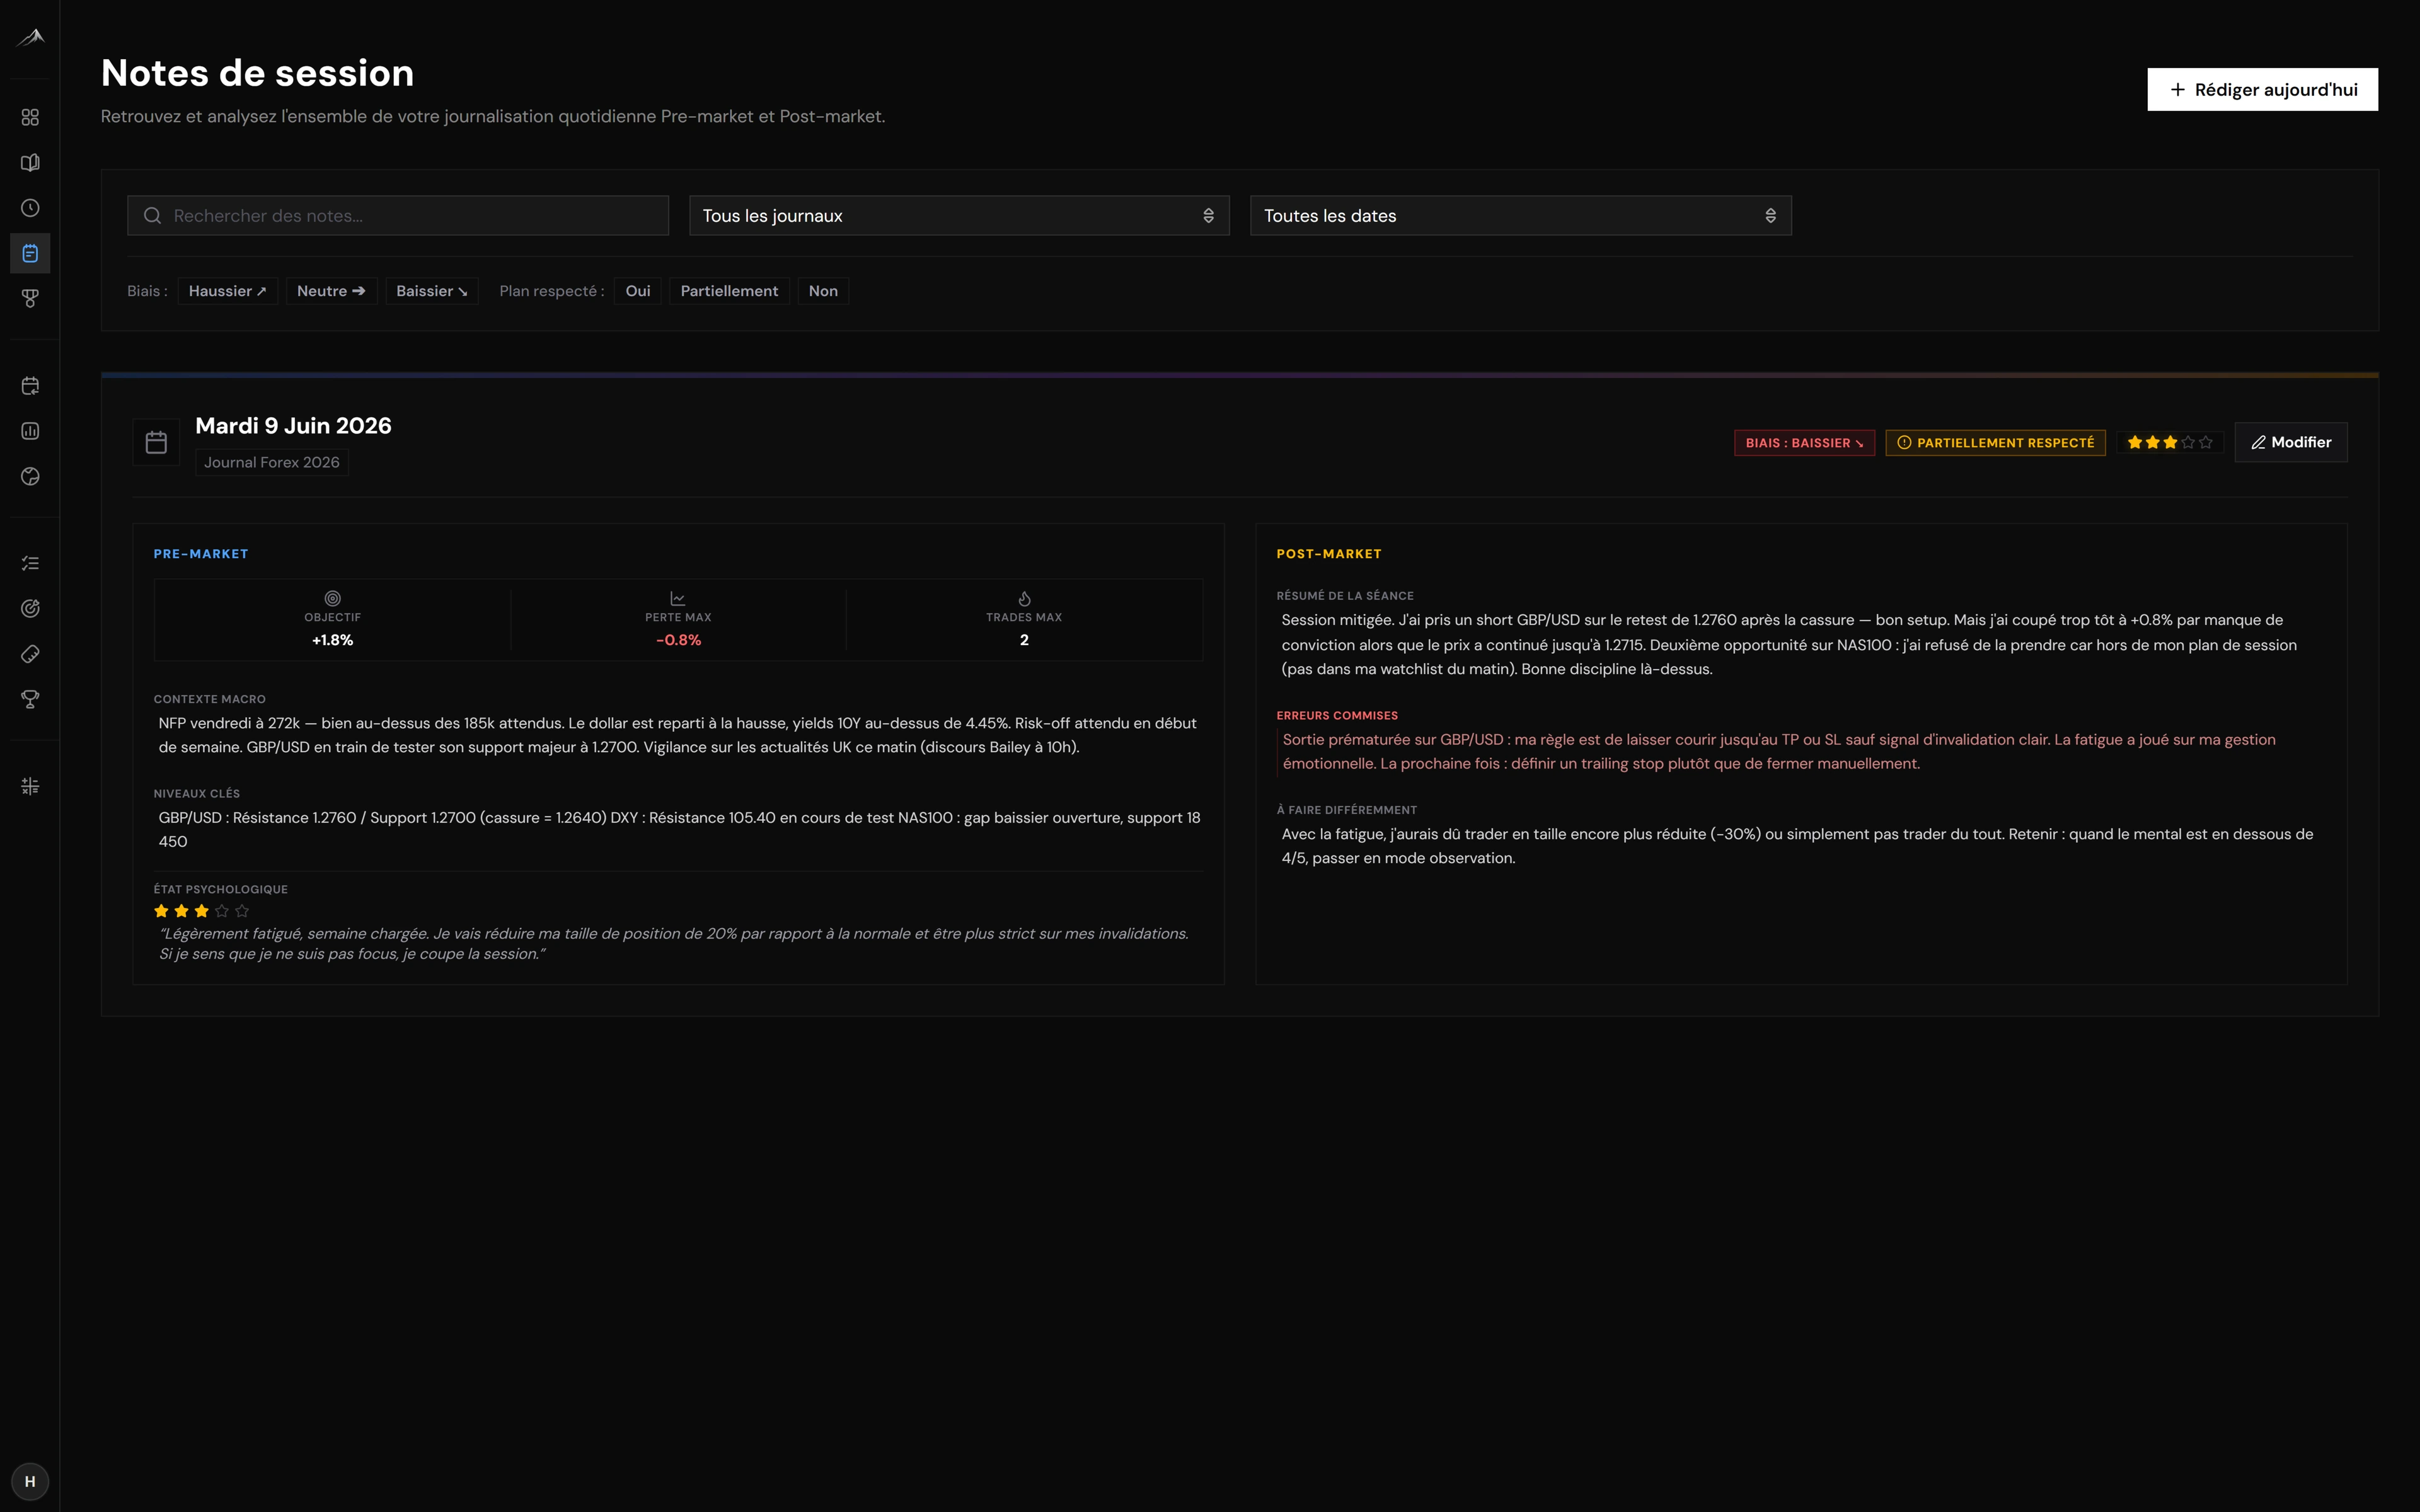
How to keep an effective trading journal (beginner guide)
The step-by-step method for a trading journal you will not drop: what to record, when to fill it in, and how to review it so it actually makes you better.
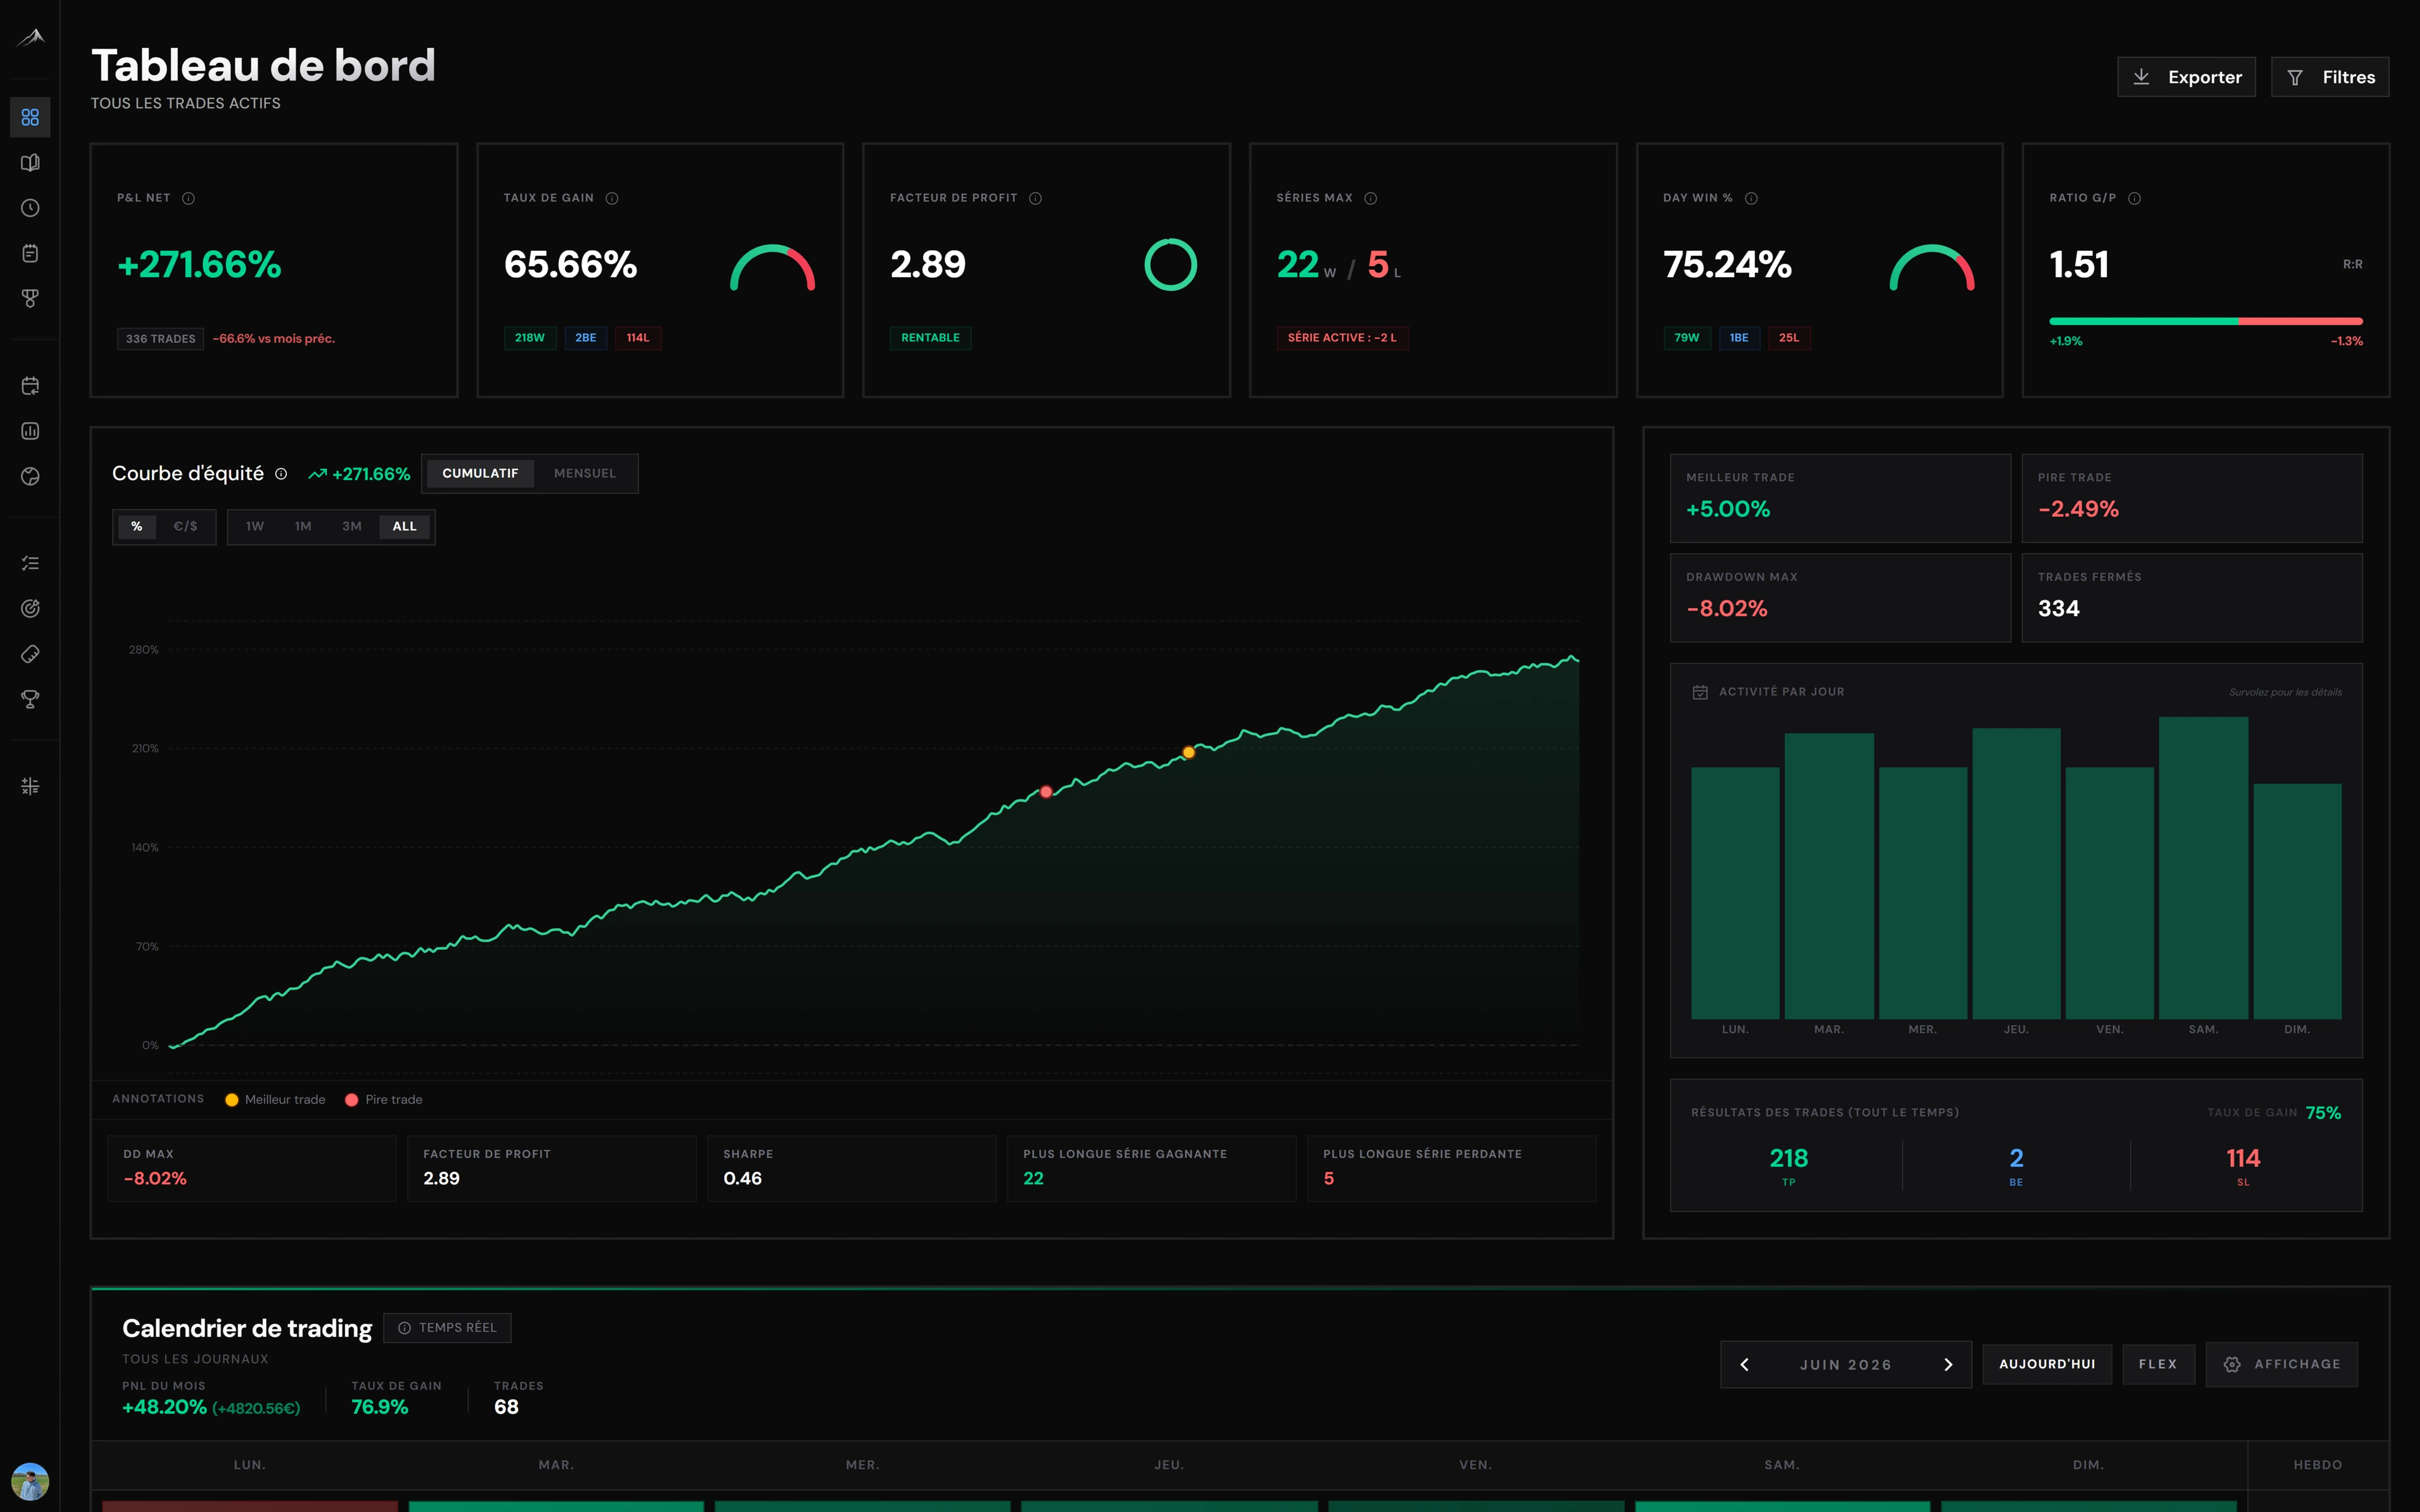
Automated vs manual trading journal: which should you choose?
Notebook, spreadsheet or automated journal: the strengths, the limits and the hidden cost of each approach, so you can choose with your eyes open.