Why most traders lose money (and how to tell if you're one of them)
What regulators and day trading studies actually found, the 5 causes that keep coming back, and a 30-minute check with your trading journal to see if you're in the losing majority.
Most traders lose money because they trade without a measured edge, and then costs, oversized positions and too many trades turn a small disadvantage into steady losses. Regulators and academic studies agree: depending on the market and the period, between 74% and 97% of retail traders studied ended up losing. The useful question is not "why do others lose" but "am I one of them", and your trading journal can answer it in 30 minutes.
What does "losing money" mean here?
A few clear definitions first, because the studies use them precisely.
- A losing account is an account whose net result over the period is negative, after all costs. For its 2018 CFD measures, ESMA counted realised and unrealised profits and losses, including fees and commissions.
- An edge is a positive average result per trade, after costs, that holds over a large number of trades.
- Expectancy is the average result per trade. Expectancy = (win rate × average win) − (loss rate × average loss).
- R is the amount you risk on a trade (entry to stop). Measuring results in R lets you compare trades of different sizes.
What does the data say?
Here are the figures that come up most, with their source and date. They describe different markets and periods, so read them as orders of magnitude, not as one universal number.
- ESMA (EU regulator), 27 March 2018. Analyses by national regulators showed that 74% to 89% of retail CFD accounts typically lose money, with average losses per client between €1,600 and €29,000.
- AMF (French regulator), study published 13 October 2014. On 14,799 active CFD and forex clients over 2009 to 2012, more than 89% lost money, with an average loss of €10,887. Clients who traded more, or with bigger sizes, lost more. Clients who kept going for four years did not do better: the AMF saw no learning effect.
- Barber, Lee, Liu and Odean, Taiwan (2004 paper, data 1995 to 1999). In a typical six-month period, more than 8 out of 10 day traders lost money. Heavy day traders made gross profits, but not enough to cover their transaction costs.
- Chague, De-Losso and Giovannetti, Brazil (2019 paper, data 2013 to 2015). Out of 19,646 new day traders in mini index futures, 1,551 kept going for more than 300 days. 97% of them lost money.
Note: the famous "90% of traders lose" is not the result of any of these studies. It's a rounded figure. When someone quotes it, ask for the source.
Why do most traders lose money?
The studies and the top guides point to the same few causes. For each one, here is what it looks like in a journal, so you can check it on your own trades.
1. No measured edge
Most traders use a setup that looked good on a few charts, then change it every few weeks. Without written rules and a large sample, nobody can tell whether the expectancy is positive. Once you pay costs, trading without an edge gives a slightly negative result by default.
In your journal: you can't say what your expectancy is, or it's based on fewer than 30 trades. Our guide on how to backtest a trading strategy explains how to measure an edge before risking money.
2. Costs eat a thin edge
Every round trip pays the spread, commissions, sometimes swaps and slippage. On one trade it's small. Over hundreds of trades it can be bigger than the edge itself. That's the Taiwan finding: heavy day traders were profitable before costs, not after.
In your journal: gross and net results are far apart, or costs per trade are a big share of 1R. Tight stops make this worse, because the same cost weighs more in R.
3. Positions that are too big
Leverage and size don't change your edge. They change how fast a normal losing streak hurts you. The AMF saw it in the data: bigger average trade size, bigger loss. ESMA's answer in 2018 was to cap retail CFD leverage.
In your journal: your risk per trade changes a lot from one trade to the next, or a few losing trades cost a large part of the account. See money management and position size.
4. Too many trades
More trades means more costs and more decisions made tired or bored. In the AMF study, clients with more transactions lost more.
In your journal: your worst days have far more trades than your average day. Our guide on overtrading shows how to set a daily cap.
5. Losses bigger than wins, and what happens after a loss
Many traders win often and still lose money, because they cut winners early and let losers run. Then, after a loss, they size up to win it back. That's the revenge trading spiral.
In your journal: your average loss is bigger than your average win, and your results are worse on trades taken right after a loss.
Am I in the losing majority? A 30-minute check with your journal
This is the part most guides skip. Take your last 50 to 100 trades and write down six numbers.
- Net result after all costs. Not gross. If it's negative, the answer is yes for this period.
- Expectancy in R. Win rate × average win in R, minus loss rate × average loss in R.
- Break-even win rate. Average loss ÷ (average win + average loss). If your real win rate is below it, you lose money even if you "win most of the time".
- Costs per trade in R. Total costs ÷ number of trades, divided by your usual 1R.
- Result of trades that broke your plan. Tag them, then compare their total with the rest.
- Result of trades taken just after a loss. Compare with your other trades.
Fictional example, for illustration only. 80 trades, win rate 55%, average win 0.8R, average loss 1R. Expectancy before costs: 0.55 × 0.8 − 0.45 × 1 = −0.01R. Break-even win rate: 1 ÷ (0.8 + 1) = 55.6%. This trader wins more than half the time and still loses. Add costs of 0.1R per trade and the expectancy drops to −0.11R, which is about −8.8R over the 80 trades.
What to read in your numbers:
- Negative expectancy before costs: the problem is the strategy or its exits. Go back to testing.
- Positive before costs, negative after: the problem is costs and trade frequency.
- Positive overall, but rule-breaking trades are deeply negative: the strategy is fine, the problem is execution. That's the easiest case to fix.
For the meaning of each statistic, see trading journal statistics.
What should you change first?
One rule per cause. Start with the one your numbers point to, not all five at once.
- No measured edge: write your rules in a trading plan, then test them on at least a few dozen trades before adding size.
- Costs: compute your cost in R. If it's large, widen your timeframe or trade less, rather than looking for a "better" entry.
- Size: fix your risk per trade as a percentage of the account and calculate the size before every entry.
- Frequency: set a maximum number of trades per day, written before the session.
- After a loss: set a rule such as "after two losses in a row, I stop for the day", and tag every exception.
If you trade a prop firm challenge, the causes are the same, with a rulebook on top. See why traders fail prop firm challenges. For the emotional side, read our guide on trading psychology.
Running this check in Altiora
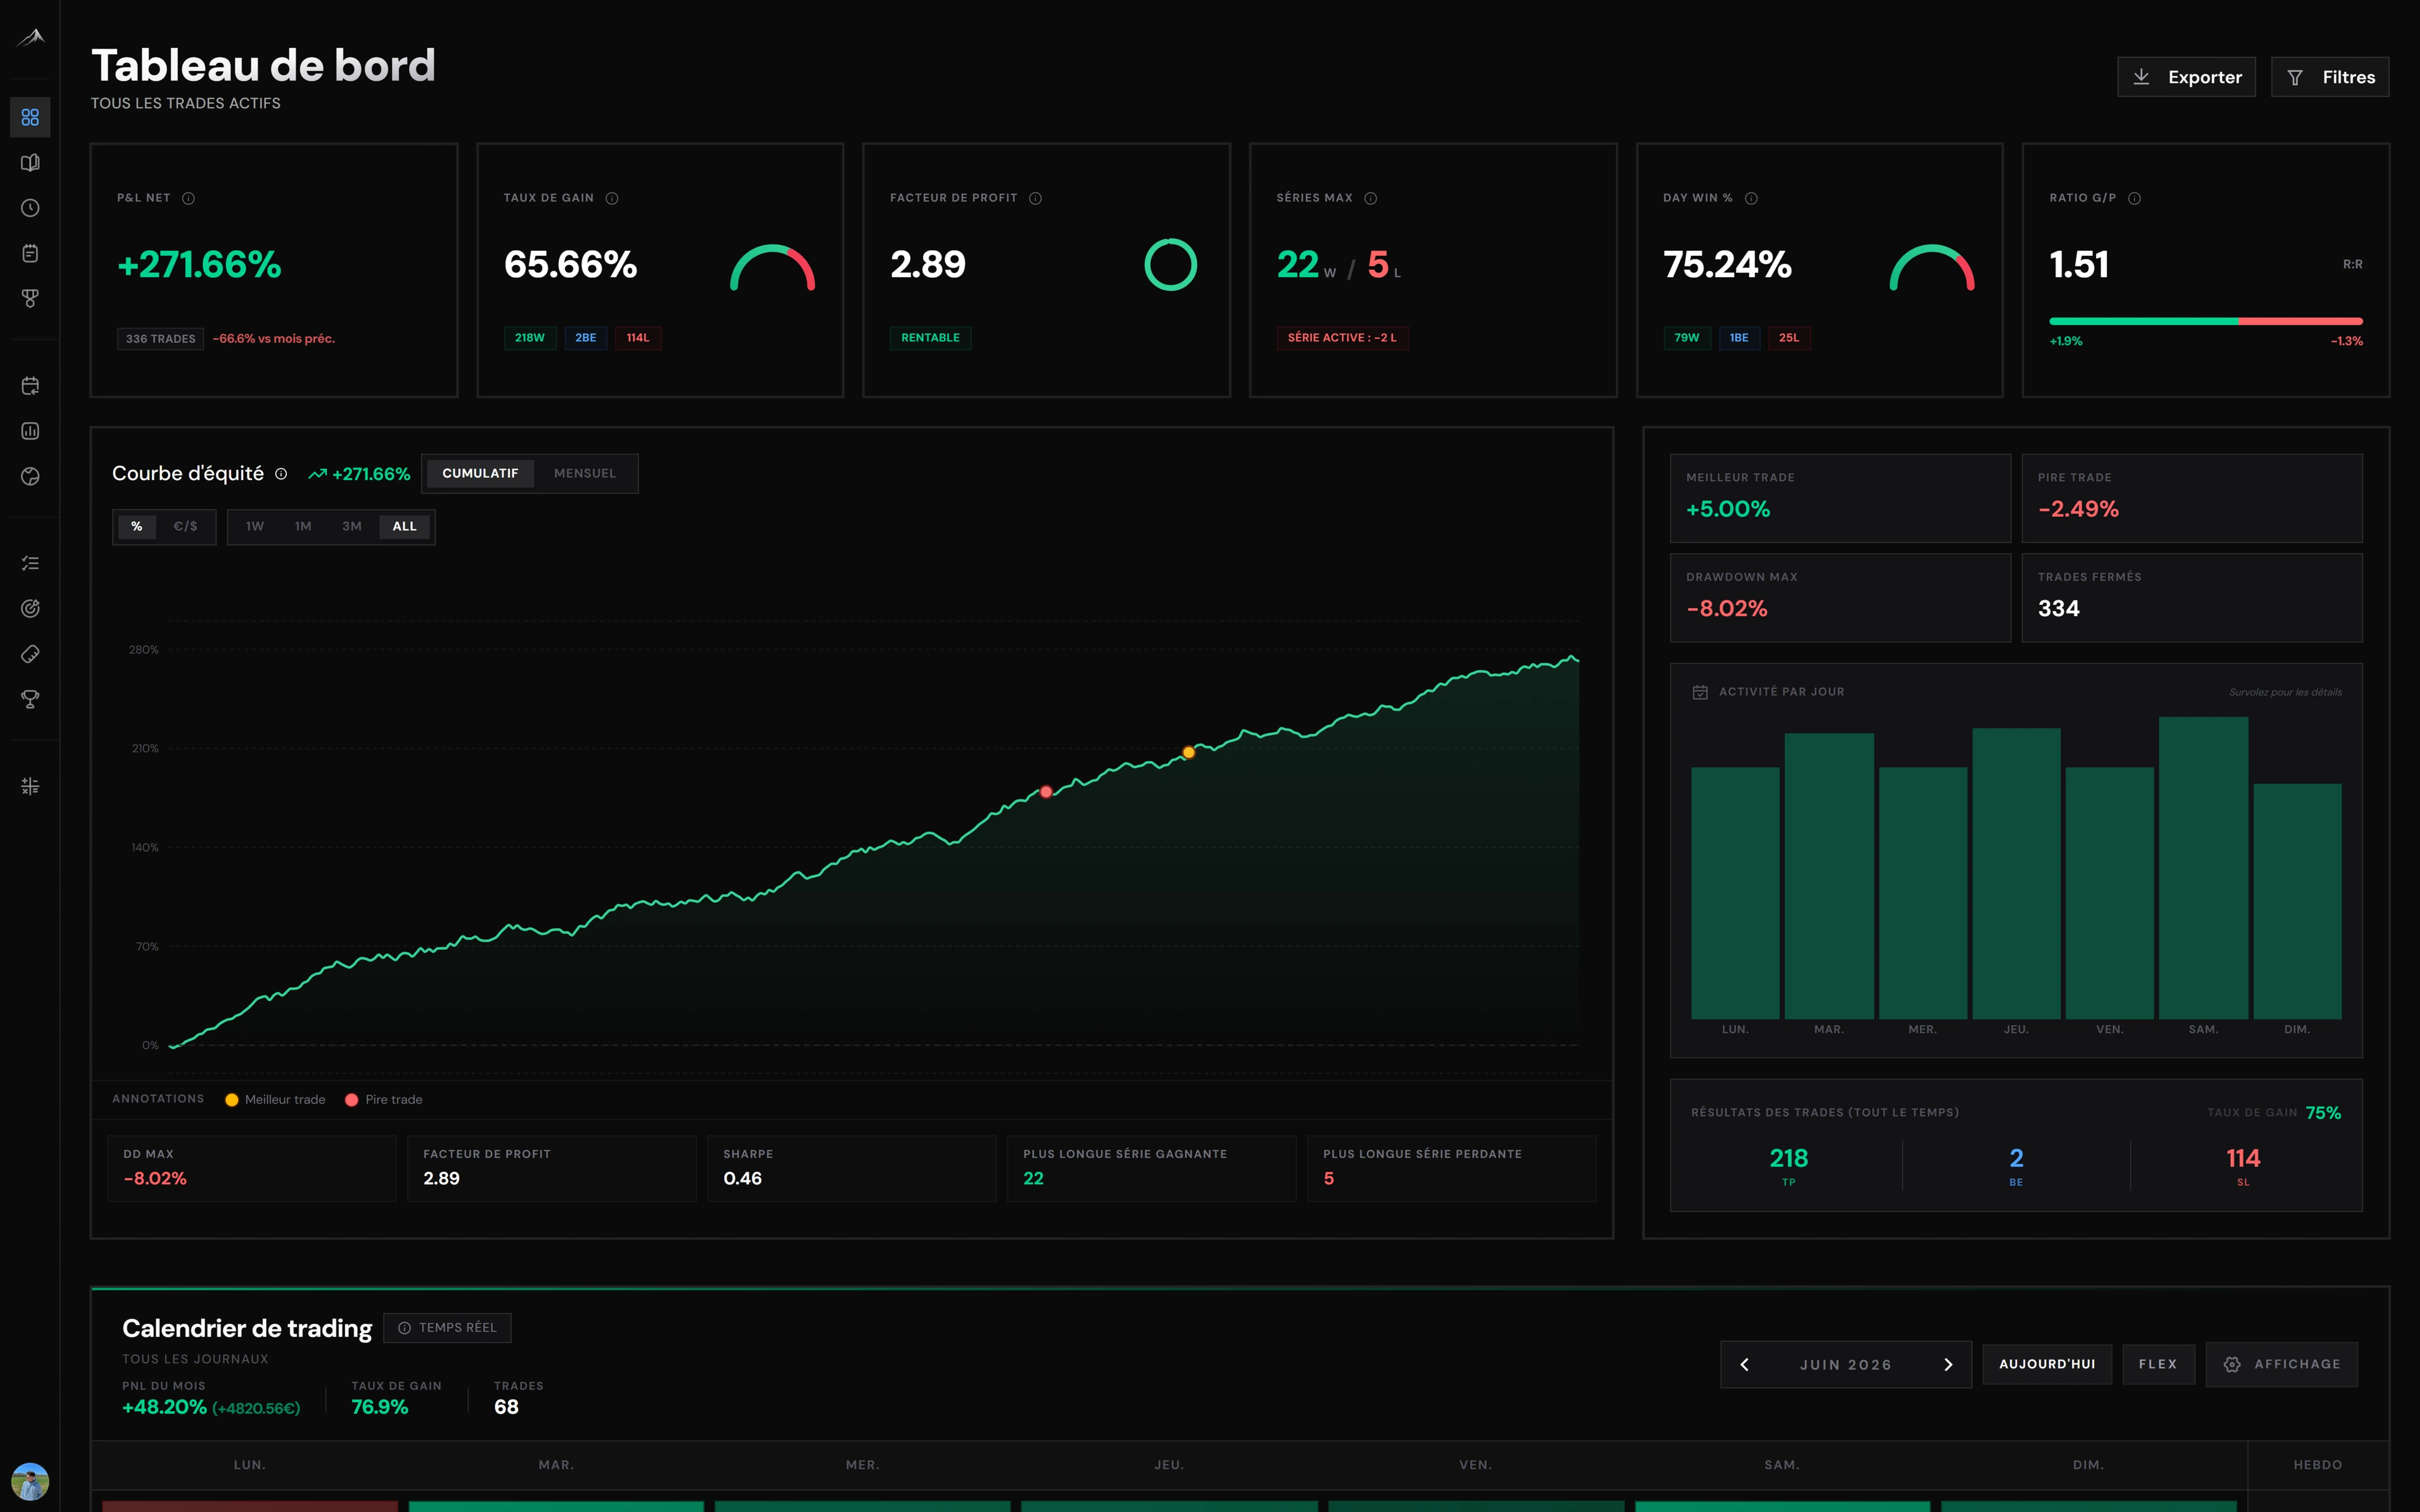
Altiora is a trading journal that does most of this check for you. P&L, win rate and profit factor are calculated on every trade, and you can break results down by session, asset or tag. A "plan broken" or "after a loss" tag is enough to compare those trades with the rest. Session notes keep track of your emotions and mental state, and the P&L calendar shows which days hurt.
The risk calculator gives you the position size from your account risk and stop distance before you enter. Trades come in through native cTrader and Tradovate connections, or through the MT4 / MT5 import or EA. See all features.
The 7-day trial gives you full access, no card. Import your last trades and run the six numbers above.
Frequently asked questions
- Why do most traders lose money?
- Because they trade without a measured edge, and costs, oversized positions and too many trades turn a small disadvantage into steady losses. Losses bigger than wins and revenge trading after a loss make it worse.
- What percentage of traders lose money?
- It depends on the market and the period. ESMA said in 2018 that 74% to 89% of retail CFD accounts lose money. The French AMF found more than 89% of CFD and forex clients lost over 2009 to 2012. A 2019 Brazilian study found 97% of day traders who kept going for more than 300 days lost money.
- Is it true that 90% of traders lose money?
- None of the main studies gives exactly 90%. It's a rounded figure. Serious studies give ranges from 74% to 97% depending on the product, the country and the period.
- How do I know if I'm a losing trader?
- Take your last 50 to 100 trades and compute your net result after costs, expectancy in R, break-even win rate, costs per trade in R, and the result of trades that broke your plan or came right after a loss. A negative net result over the period answers the question.
- Can a losing trader become profitable?
- The data shows experience alone is not enough: the AMF saw no learning effect over four years. What helps is measuring your trades, finding the main cause in your numbers and changing one rule at a time.
About the author
L’équipe Altiora
Altiora editorial team
Altiora's editorial team brings together active traders and the product team. We write about discipline, journaling and performance analysis, grounded in how the platform actually works. We never give investment advice.
Read next
Overtrading: how to spot it and stop
Overtrading means trading outside the plan, not just clicking too much. Measurable signs, common causes, and a 7-day protocol to bring volume back in line.

Trading plan example: a concrete template you can copy
A useful trading plan fits on one page. Here is a concrete example and a template to adapt, with enough structure to trade without rewriting the rules every session.
Trading psychology: understanding and correcting behavioural mistakes
Discipline is not a personality trait, it is measurable data. How to identify and correct the biases that sabotage your trading.